How Many Participants Should I Recruit? A Guide to Conducting a Power Analysis to Determine Experiment Sample Sizes
Conducting a power analysis is the best way to answer the question, "How many participants should I recruit for my HRI study?" To conduct a power analysis, I'd suggest using the free and well-used G*Power tool.
When calculating sample size using a power analysis, G*Power is pretty easy to follow. You select the statistical test you plan to run, the type of power analysis you want to conduct, and input some parameters -- and voila, you have the number of participants you should run in order to ensure that your study is sufficiently powered. Now, here are some notes on how to determine your parameter values:
- Effect size: The best way to determine an effect size is to find a human subjects study examining a similar research question to yours and use the effect size reported in that other study. If you cannot find a listed effect size, it's best practice to assume a medium effect size. I've found this Rules of thumb on magnitudes of effect sizes web page to be helpful in determining small/medium/large effect sizes and also converting between effect sizes.
- α err prob: Typically, we use a value of 0.05 here, representing the fact that statistical significance is determined by p-values less than 0.05.
- Power (1-β err prob): This represents the desired statistical power of the study. For in-person human subjects studies, I recommend going with a power of 0.80 (or 80%). For online studies (e.g., Prolific, AMT), you may want to go with a higher power of 0.90-0.95 (09%-95%).
- Number of groups: This represents the number of experimental between subjects groups your study contains.
- Numerator df: You may be asked to detail the number of degrees of freedom your study contains. I've found this Degrees of Freedom Tutorial helpful in better understanding how to determine the number of degrees of freedom a study has.
- Number of measurements: If you are conducting a study where you repeatedly take measurements of the same participant, this value will represent how many measurements each participant receives.
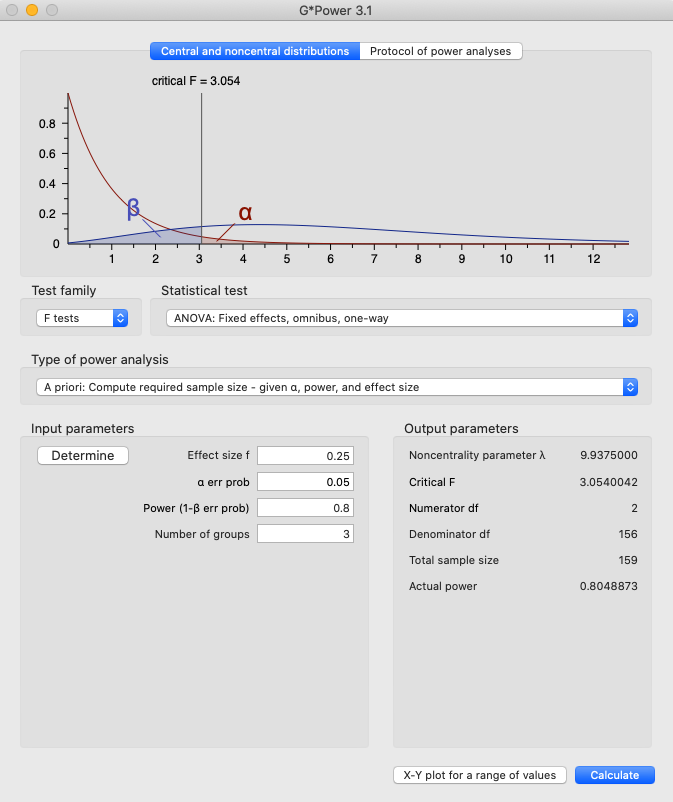
The following screenshot represents an example of a power computation for a 1-way ANOVA analysis with a medium effect size and 80% power for a 3 condition between subjects design. Based on this analysis, I should have a total sample size of 159. 159/3 = 53, so I should recruit and run 53 participants in each of my 3 between subjects conditions.
Which Statistics Test Should I Run? A Guide to Conducting a Statistical Analysis on HRI Data for Independent Samples
Software Setup
I use the R programming language and RStudio IDE to perform data analysis. I like using R because it's free, has solid online documentation, and enables users to perform a wide array of statistical tests that are not always available on other platforms (e.g., multi-level mixed-effects models).
Working with an Example
In this HRI statistical analysis guide, we will use an example from one of my prior studies. The main focus of this study was a 30 minute period of time where 3 human participants (2 ingroup members, 1 outgroup member) tried to decide which survival items they would want to bring with them in an imaginary survival scenario. Additionally, one of the participants was designated as the robot liaison, the robot liaison was the only one who could ask the robot for information about the survival items and the environment where they were to be stranded. Thus, this study had a 2 (robot liaison: ingroup member or outgroup member) x 2 (robot backchannels: present or absent) between subjects design. We were interested to see if 1) the robot liaison role and 2) whether or not the robot backchanneled (with utterances like "mm hmm", "yeah") would influence how included and psychologically safe people felt in the group as well as the participants' backchanneling behavior. We surveyed participants before the experiment to get information about their age, gender, prior familiarity with the other participants, extraversion, and emotional intelligence. After the 30 minute interaction, we surveyed participant to assess how included and psychological safe they felt in the group. Through examining logs of the experiment interaction, we (the researchers) counted the number of backchannels produced by the robot and by the group. If you want to find more details about this data, please refer to my HRI 2020 and Frontiers in Psychology 2020 publications.
One very important note to make here is that we are considering each group to be 1 data point (we will examine the influence of our independent variables on the aggregated behavior of the entire group). This ensures that each of our data points is independent of all of the other data points in our analysis. All of the tests described in this section are only valid if each sample is independent of the other samples in the dataset. For example, if we considered each participant to be one data point, the participants who were in the same group would not be independent of one another, and the assumptions made by these tests (independent samples) would not hold.
Selecting the Right Statistical Test
The first step to take when choosing which statistics test to run on your data to answer a specific research question is first identifying the following variables:
- Independent Variable(s) - any variables that the researchers directly manipulate can be considered independent variables, in this example we have 3 possible independent variables: robot liaison identity (ingroup or outgroup member), the presence of robot backchannels (present or absent), and the number of robot backchannels
- Dependent Variable - the dependent variable is the variable that is being studied and is also called the outcome variable
- Covariate(s) - covariates (or control variables) are a subclass of independent variables, these variables are not the primary variables manipulated by researchers, but may still have an influence on the dependent variables; in this example we have several possible covariates: the gender composition of the group, the average age of the group members, the average prior familiarity of group members with one another, the average extraversion of the group members, the average emotional intelligence of group members
Next, we must consider whether the independent and dependent variables we're investigating are categorical or continuous.
- Categorical variables can be sorted into categories and do not hold any numeric value, even if they are represented by a number. Here are some examples of categorical variables: gender, the presence of robot backchannels (present or absent), whether or not the group produced more than 100 backchannels (any yes/no variables can automatically be considered categorical).
- Continuous variables hold numeric values that vary along some numeric range. Continuous variables can be responses to Likert questionnaire ratings (e.g., psychological safety and inclusion ratings), a count of behavior occurrences (e.g., the number of backchannels produced by the human participants), or a numeric observation (e.g., a participant's age).
Now that we have a handle on the types of variables we're dealing with and whether those variables are categorical or continuous, we can now determine what kind of statistical test to run to answer our research question. By answering the following questions you can determine which test you should run:
-
Are the independent variable(s) categorical?
-
Is there one independent variable?
-
Is the dependent variable categorical?
- Are there no covariates? → Run a Chi Square test
- Are there any covariates? → Run a logistic regression
-
Is the dependent variable continuous?
- Are there no covariates? → Run a t-test or a 1-way ANOVA (they are analogous)
- Are there any covariates? → Run a 1-way ANOVA
-
Is the dependent variable categorical?
-
Are there multiple independent variables?
- Is the dependent variable categorical? → Run a Logistic Regression
- Is the dependent variable continuous? → Run a 2-Way ANOVA
-
Is there one independent variable?
-
Are the independent variable(s) continuous?
-
Is the dependent variable categorical?
- Are there no covariates? → Run a Pearson correlation or a logistic regression
- Are there any covariates? → Run a logistic regression
-
Is the dependent variable continuous?
- Are there no covariates? → Run a Pearson correlation
- Are there any covariates? → Run a linear regression
-
Is the dependent variable categorical?
Examples of Each of the Aforementioned Statistical Tests in R
In the following files you will find 1) a sample data file from the example described above and 2) an R file that gives an example of each of the statistical tests mentioned above using the example data:
Which Statistics Test Should I Run? A Guide to Conducting a Statistical Analysis on HRI Data for Grouped (Non-Independent) Samples
Software Setup
Like with statistical analysis on independent samples data, I use the R programming language and RStudio IDE to perform my data analysis. One of the primary reasons I use R is because R has the best documentation and ability to use a wide array of statistical tests for grouped samples that are not always available on other platforms (e.g., the multi-level mixed-effects models that will be described below).
Working with an Example
For our grouped samples analysis, we'll use another example from one of my prior studies. This time, we will consider each person to be one individual data point, where each individual participant is "grouped" with the other participants that they interacted with during the study. For this study, we had three participants and one Nao robot completing a collaborative task of constructing railroad routes on a tablet screen. If each individual succeeded in building a valid section of the railroad route, the team would succeed that round. However, if even one member failed to build a valid railroad route section, the team would fail that round. There were 30 rounds of this task during the experiment. At the end of every round the robot would either 1) make a vulnerable utterance, 2) make a neutral utterance, or 3) say nothing. These represented our 3 between subjects conditions: vulnerable robot, neutral robot, and silent robot. We were interested to see how the robot's utterances would shape how people viewed the robot and how participants interacted during the game (e.g., if they made a mistake did they explain it to the group?). If you want to find out more about the data, you can refer to my HRI 2018 paper, my PNAS 2020 paper, and/or my dissertation.

Mixed-Effects Models
Because the data associated with each participant is not independent of the rest of the participants' data, we cannot use the tests outlined in the prior section like t-tests and ANOVAs. Instead, we must use a mixed-effects model which captures both fixed effects and random effects. Fixed effects are effects that we can capture and are non-random, including most independent variables (e.g., experimental condition variables, covariates). Random effects represent random variables in a statistical model. The random effect that we'll be controlling for in HRI analyses with grouped samples is the groupings of participants. For example, if participants 1, 2, and 3 are in group A and participants 4, 5, and 6 are in group B we can have one variable in our model that captures participant groups, where the "group" for participant 1 is A and the "group" for participant 5 is B.
While specifying the random effect in a mixed-effects model, you will also have to specify how that random effect relates to the intercept and slope of the model. I've typically always used a specification of a random intercept with a fixed mean for the random effects I've dealt with (which have exclusively been applied to participants in groups). In R this translates to specifying the random effect as: (1 | group), assuming that "group" is the variable name representing my random effect.
Here are some other resources I'd recommend checking out on mixed-effects models:
- Mixed Models with R by Github user m-clark
- LME4 Tutorial: Popularity Data by Rens van de Schoot
Selecting the Right Statistical Test
The selection process for the right statistical test is simpler for grouped samples, however, the process of fitting the model is more complex. When determining which statistics test to run, the main determining factor is whether the dependent variable is categorical or continuous:
-
Is the dependent variable categorical? → Run a generalized linear miexed-effects model with a binomial family and logit link
- I typically use the glmer function from the lme4 R package with the additional argument: family=binomial(link = "logit")
-
Is the dependent variable continuous? → Run a linear mixed-effects model
- I typically use the lmer function from the lme4 R package
Achieving a Good Model Fit
For these mixed-effect models, one way to refine the statistical model is to find the model with the best fit by systematically eliminating covariates that do not have a significant influence on the model's outcomes. I have modeled how to do this in the example R files below. Basically, the process involves running the mixed-effects model (with REML=FALSE if you're using a lmer model) and eliminating one-by-one covariates that have a non-significant influence over the model's outcome variable - each time eliminating the covariate with the largest p-value as long as it's not lower than 0.05. Once you've gone through this process, you can compare the model fits for all of those models by running an ANOVA test on the models. The ANOVA will output AIC (Akaike Information Criterion) and BIC (Bayesian Information Criterion), the lower these values are, the better the model fit. Compared with AIC, BIC imposes a larger penalty for including more variables and prefers a less complex model. You can choose either criterion to use to select the model with the best fit, and then choose the model that has the lowest value of the criterion you choose. Then, you can run the final version of that model (with REML=TRUE if you're using a lmer model) and you have your end result.
There are a few other tests that are good to do in order to ensure a good model fit (which are included in the examples provided):
- ensuring that plots of the residuals don't contain values greater than 3 standard deviations away from the mean and that there aren't any trends
- plotting the dependent variable (y-axis) against the model predictions (x-axis) to ensure that the model seems to be fitting well (data points are clustered around the prediction line)
Examples of Each of the Aforementioned Statistical Tests in R
For each of the two tests described above, you will find 1) a sample data file and 2) an R file that provides an example of using the test on the example data:
- Categorical dependent variable evaluated with the generalized linear mixed-effects model
- Continuous dependent variable evaluated with the linear mixed-effects model